Data Visualisation Tips for Annual Reports
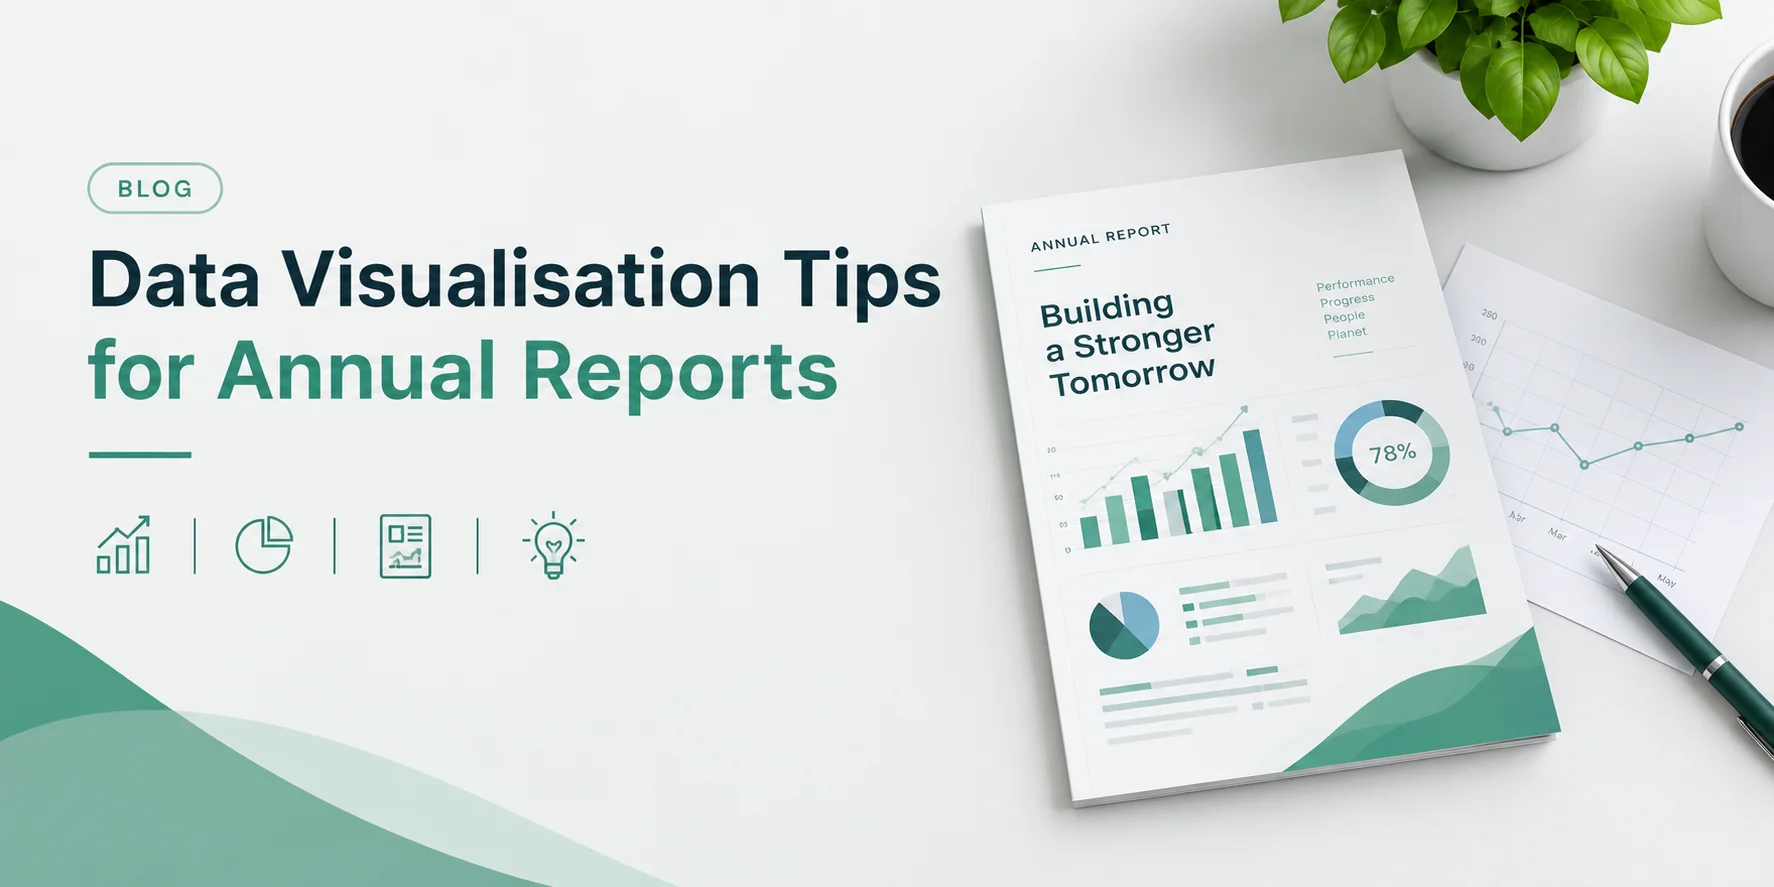
A page of raw figures tells your stakeholders almost nothing on its own. That's what this article gets into: how to turn dense financial data into charts, graphs and visuals that people actually understand at a glance. Corporate reporting has become increasingly complex in recent years, and that's exactly why the best annual report design Ireland has to offer leans so heavily on visuals rather than tables of numbers. Below, we'll cover practical ways to make your own report's data easier to read, trust and remember.
Objective
This guide is aimed at Irish businesses preparing their next annual report. We want to give you clear, usable tips for presenting financial and operational data visually, so your report gets read properly rather than skimmed and shelved.
Key Takeaways
- Charts and graphs help readers absorb complex figures far faster than text alone.
- Not every chart type suits every dataset. Picking the right one matters.
- Consistent colour and style across visuals builds trust and clarity.
- Too much data on one page defeats the purpose of visualising it.
- A good design partner will match visuals to your actual story, not just decorate the numbers.
Why Does Annual Report Design Ireland Rely on Strong Data Visualisation?
Financial data on its own is hard work for most readers. Visuals do the heavy lifting, turning rows of figures into something a shareholder or employee can understand in seconds.
Readers Skim Before They Read
Most people flick through an annual report before deciding what's worth their time. A well-placed chart catches the eye and pulls readers into the sections that matter most.
Numbers Alone Rarely Persuade
A 12% revenue increase means little without context. Show it against previous years in a simple line graph, and the trend becomes obvious immediately.
Choosing the Right Chart for Your Data
Different data types call for different visual formats. Getting this wrong can confuse readers rather than help them.
- Line graphs are the go-to for change over time. Revenue, headcount, whatever's trending up or down.
- Bar charts work when you're comparing categories side by side, say regional performance or department spend.
- Pie charts should stay simple. A two or three-way budget split is about their limit before they get messy.
- Infographics are handy for summing up a whole section, like sustainability progress or a year's key milestones. Our infographic design service covers this kind of work in detail.
Avoid Overcomplicating a Simple Message
If a single number needs explaining, a chart isn't always necessary. Sometimes a clear callout stat with one line of context does the job better than a graph nobody needs.
How Can You Keep Visuals Consistent Across the Report?
Consistency isn't just about looking polished. It helps readers navigate the report without relearning your visual language on every page.
Stick to a Limited Colour Palette
Pick two or three core colours tied to your brand and use them throughout every chart and graph. Random colour choices per page make a report feel disjointed.
Use the Same Chart Style Throughout
If revenue is shown as a line graph in one section, don't switch to a bar chart for the same metric elsewhere. Repetition builds familiarity, and familiarity builds trust.
Typography Matters Too
Labels, captions and axis text should follow one consistent font and size across the whole document. Small inconsistencies add up and make a report look rushed.
Not sure how to bring this all together? Get in touch with our team and we'll talk through what would work best for your report.
Choosing the Right Annual Report Design Firm
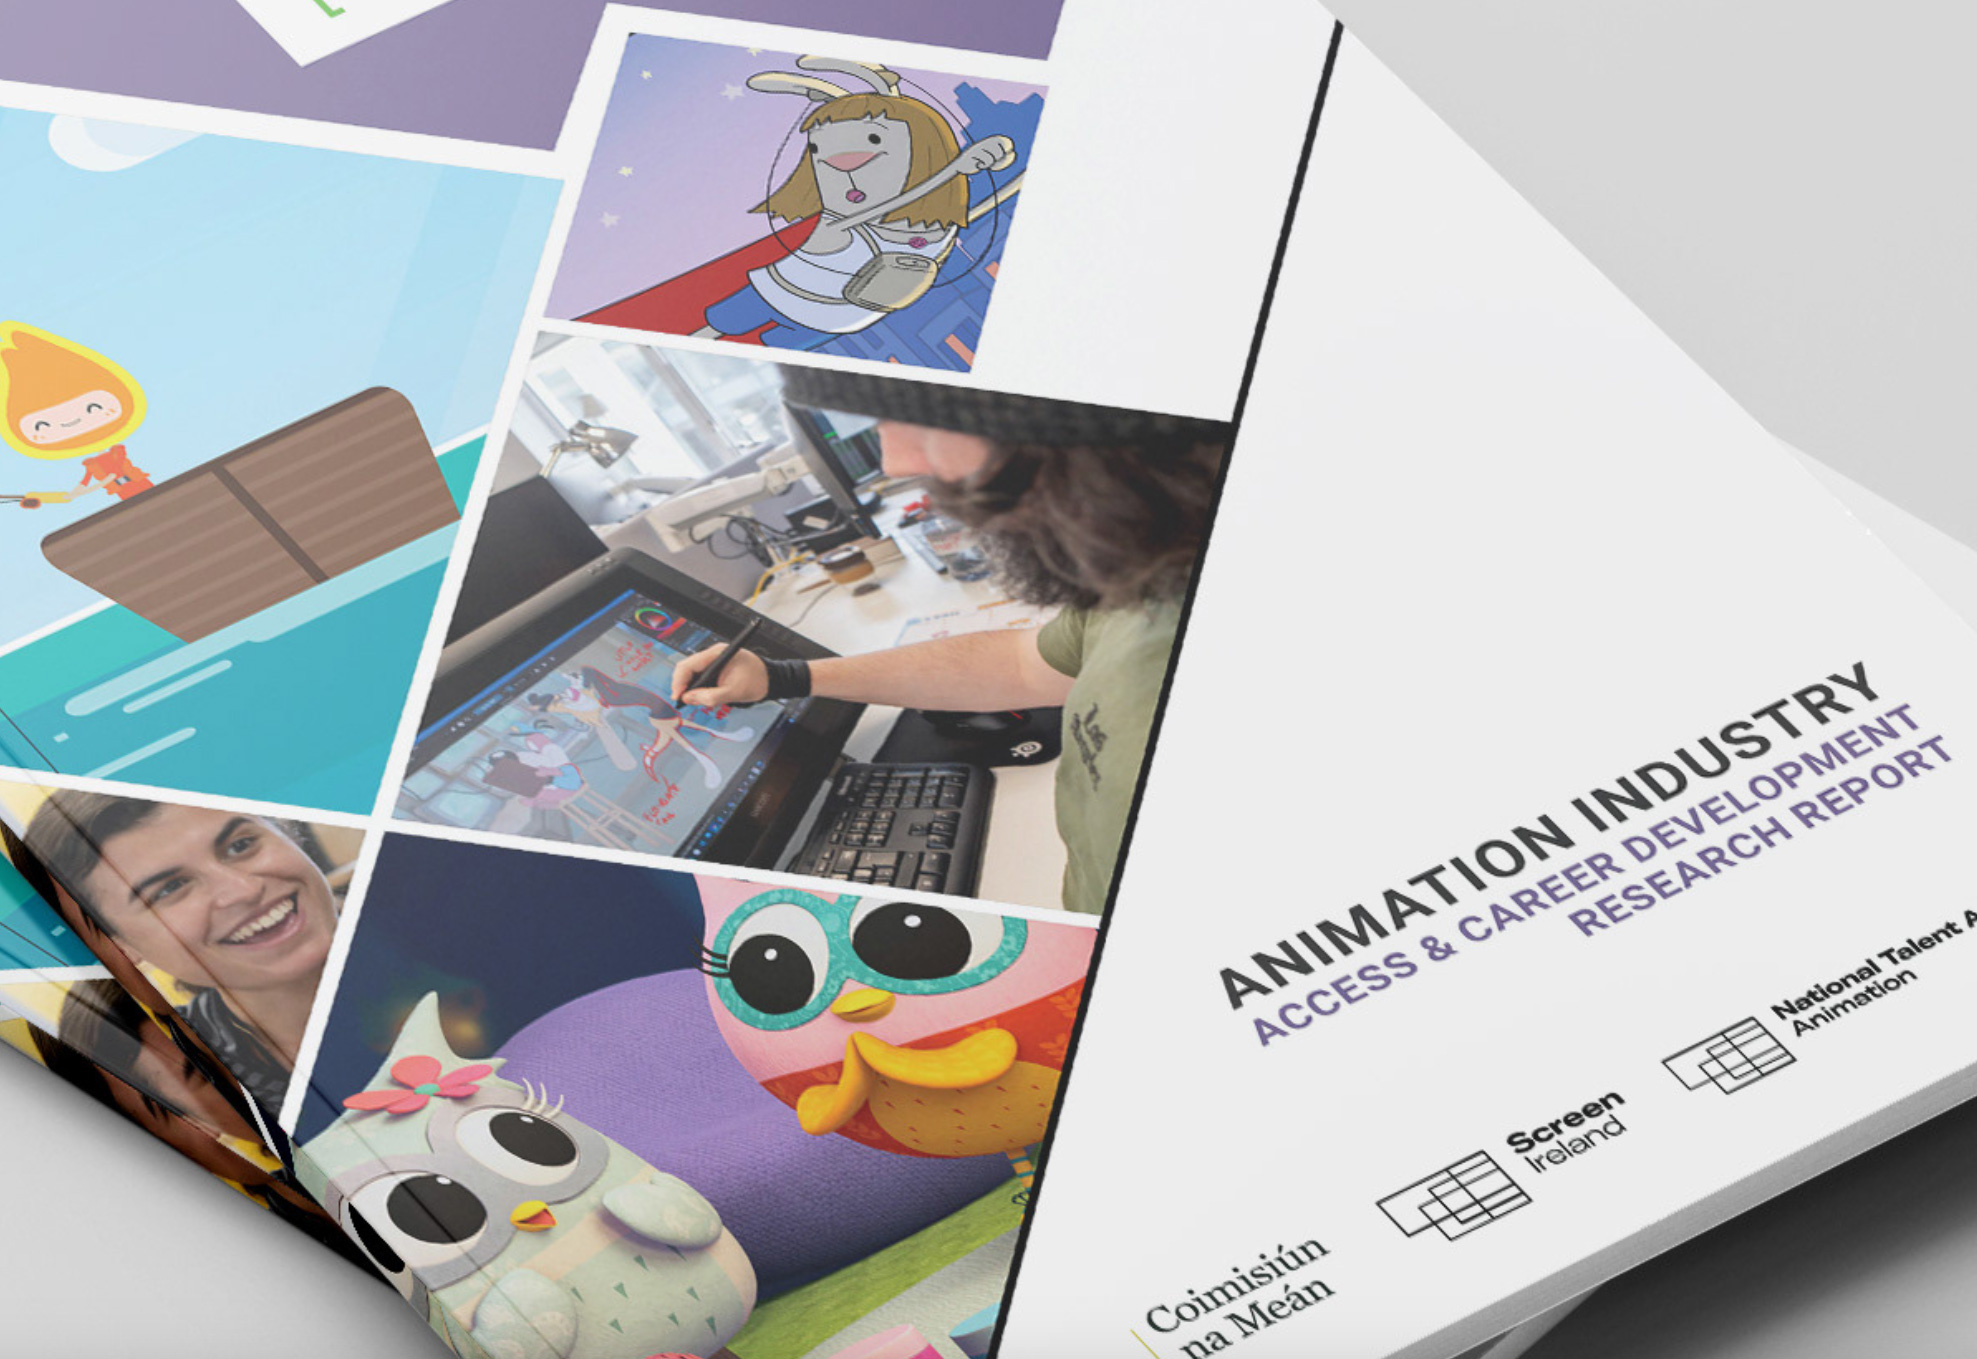
Not every studio approaches data visualisation the same way. Some treat it as decoration added at the end. Others build the visuals around the actual narrative from the start, which tends to produce a far more coherent finished report.
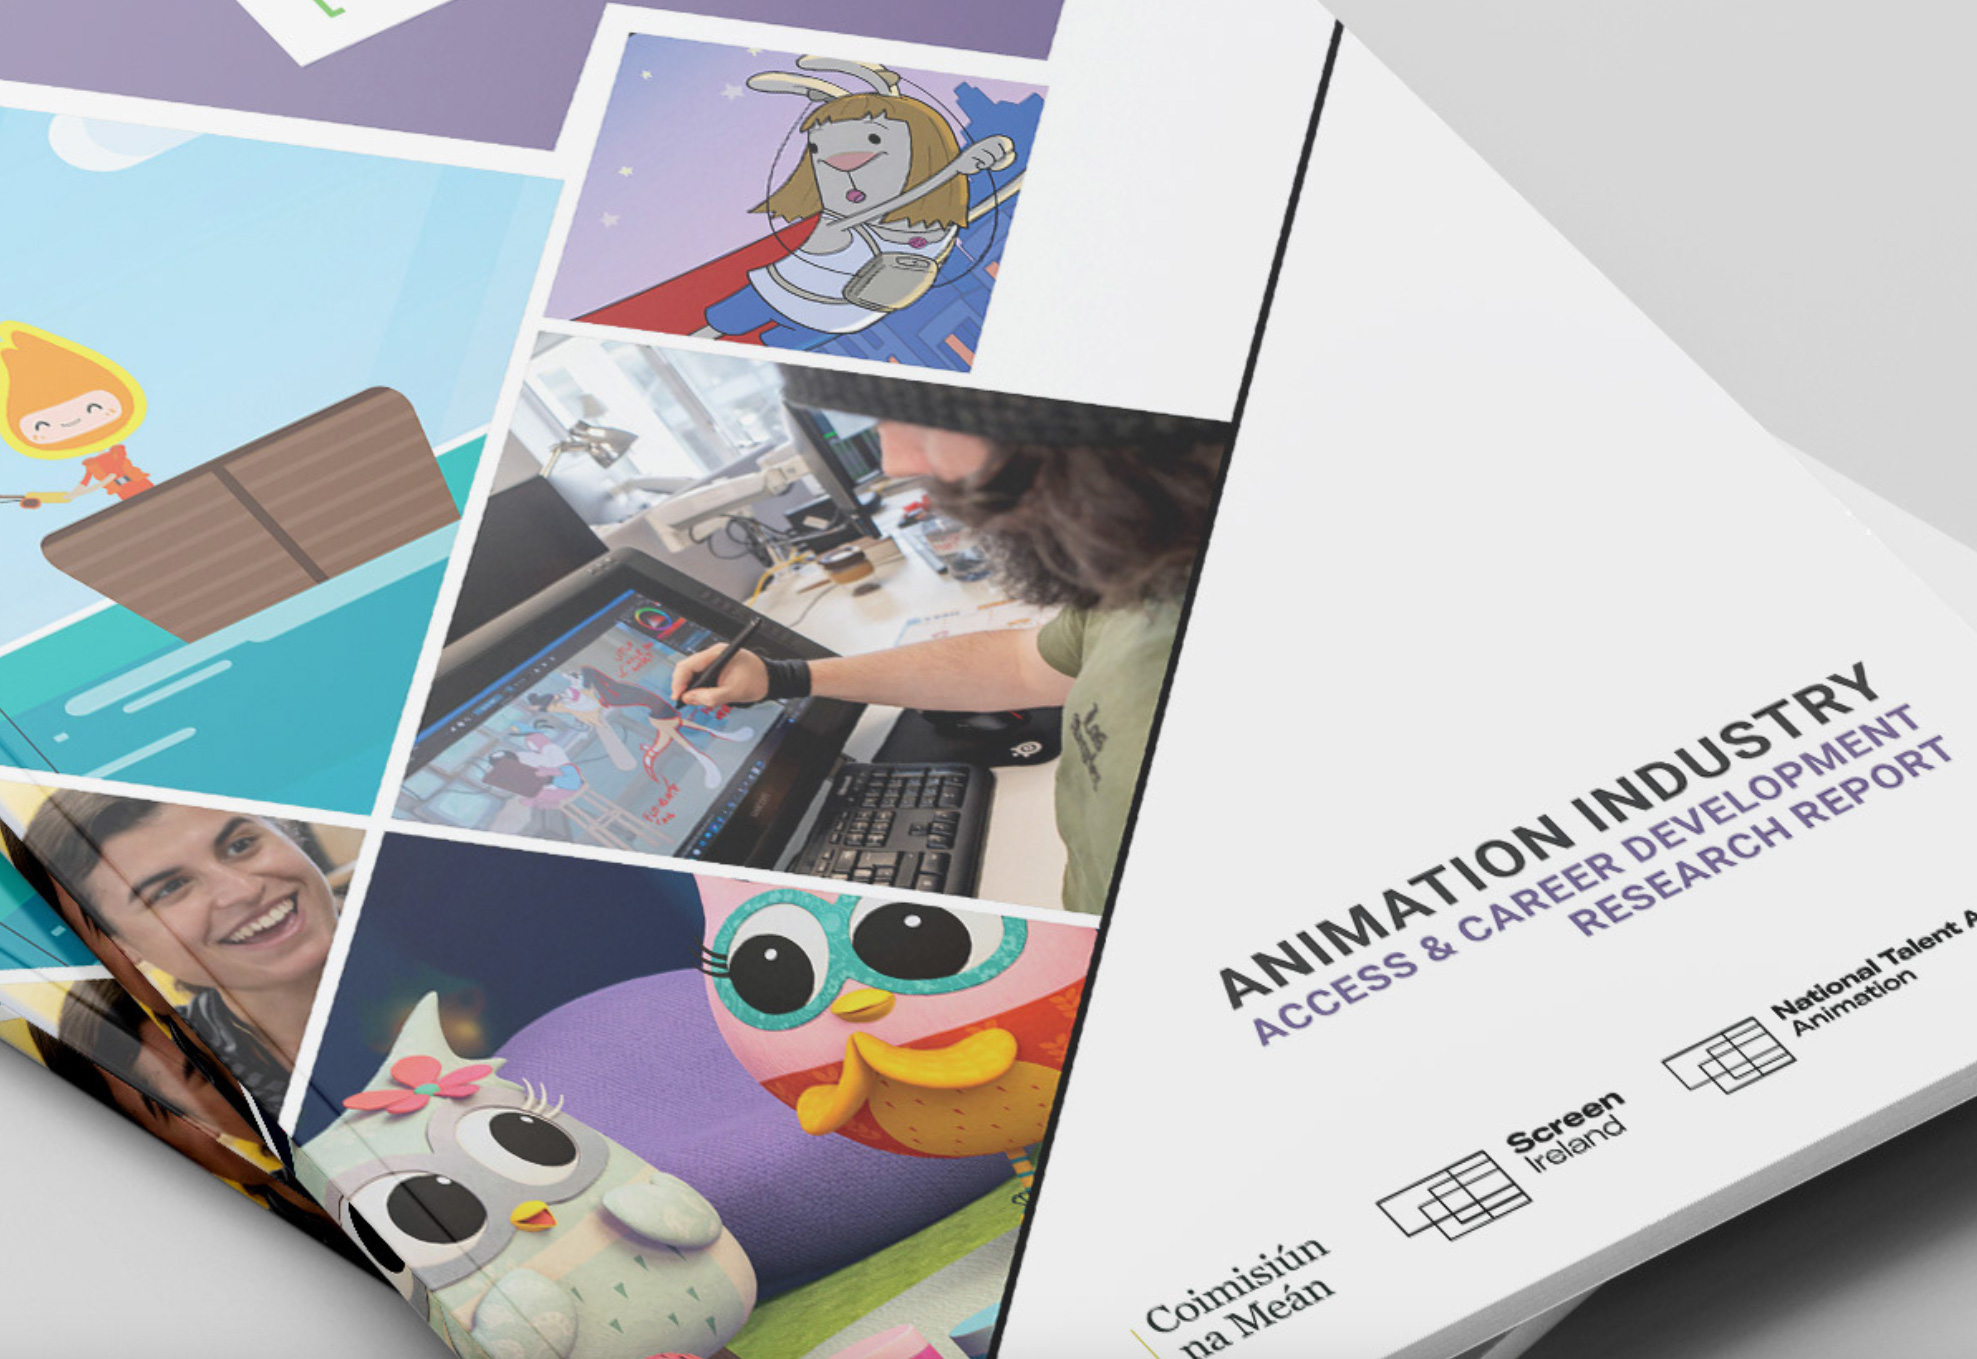
- Ask to see previous reports, not just general design portfolios.
- Check whether they involve your finance team early in the process.
- Look for examples where complex data has been simplified well, not just made colourful.
Practical Tips for Presenting Data Clearly
A few small habits make a noticeable difference to how readable your finished report is.
- Round large numbers where precision isn't essential (€2.4m rather than €2,437,982).
- Leave white space around each chart so it doesn't compete with surrounding text.
- Add a one-line takeaway under each visual so readers don't have to interpret it alone.
- Test your report with someone outside finance before it goes to print.
Ready to get your next report looking sharper? Request a quote and we'll help you plan the visuals from the ground up.
Getting Annual Report Design Ireland Right With Better Data Visuals
Strong data visualisation isn't about making a report look pretty. It's about making sure the story behind your numbers actually reaches the people reading it. Pick the right chart types, keep your style consistent, and work with a design firm that understands both the data and the narrative. Pixelo Design has helped Irish businesses turn dense annual reports into documents people genuinely engage with, and we'd be glad to help with yours too.
Frequently Asked Questions
1. Why is annual report design Ireland so focused on visuals?
The brain processes charts and images far faster than blocks of text. Key messages land quicker, and they stick around longer too.
2. What's the biggest mistake companies make with annual report visuals?
Cramming too many charts onto one page. It overwhelms readers instead of helping them, and the figures that actually matter get buried.
3. Should every financial metric be turned into a chart?
No, not at all. Simple figures often work better as a plain callout stat rather than a chart built just because you can.
4. How do you keep data visualisation consistent across a long report?
Pick a limited colour palette and stick to it. Repeat the same chart style for the same type of data, and keep your typography uniform from cover to cover.
5. Can a small business benefit from professional data visualisation in its annual report?
Yes. Clear visuals help smaller businesses look organised and credible, which matters just as much to investors and stakeholders as it does for larger companies.
If you'd like help planning your next report, contact Pixelo Design and we'll talk you through how we can make your data easier to read and remember.